
How This ETF Comparison Checklist Works
Learning how to compare ETFs means examining their objectives, costs, holdings, performance history, liquidity, and structure rather than relying on a fund name or one headline number.
This checklist explains how to organize that research using current fund documents and reliable trading information. It does not identify a preferred fund or replace an assessment of your circumstances, objectives, and risk tolerance.
What an ETF Is
An exchange-traded fund, or ETF, is a fund that can hold stocks, bonds, money-market instruments, other assets, or a combination of assets. Each ETF has an investment objective that describes what it is designed to pursue.
ETF shares trade on an exchange while the market is open. The price available to a buyer or seller is a market price, which can be higher or lower than the value of the fund’s underlying assets.
An ETF may use a passive strategy or an active strategy. A passively managed index ETF generally seeks to track an index, while an actively managed ETF follows investment decisions made under the fund’s stated strategy.
Why Comparing ETFs Matters
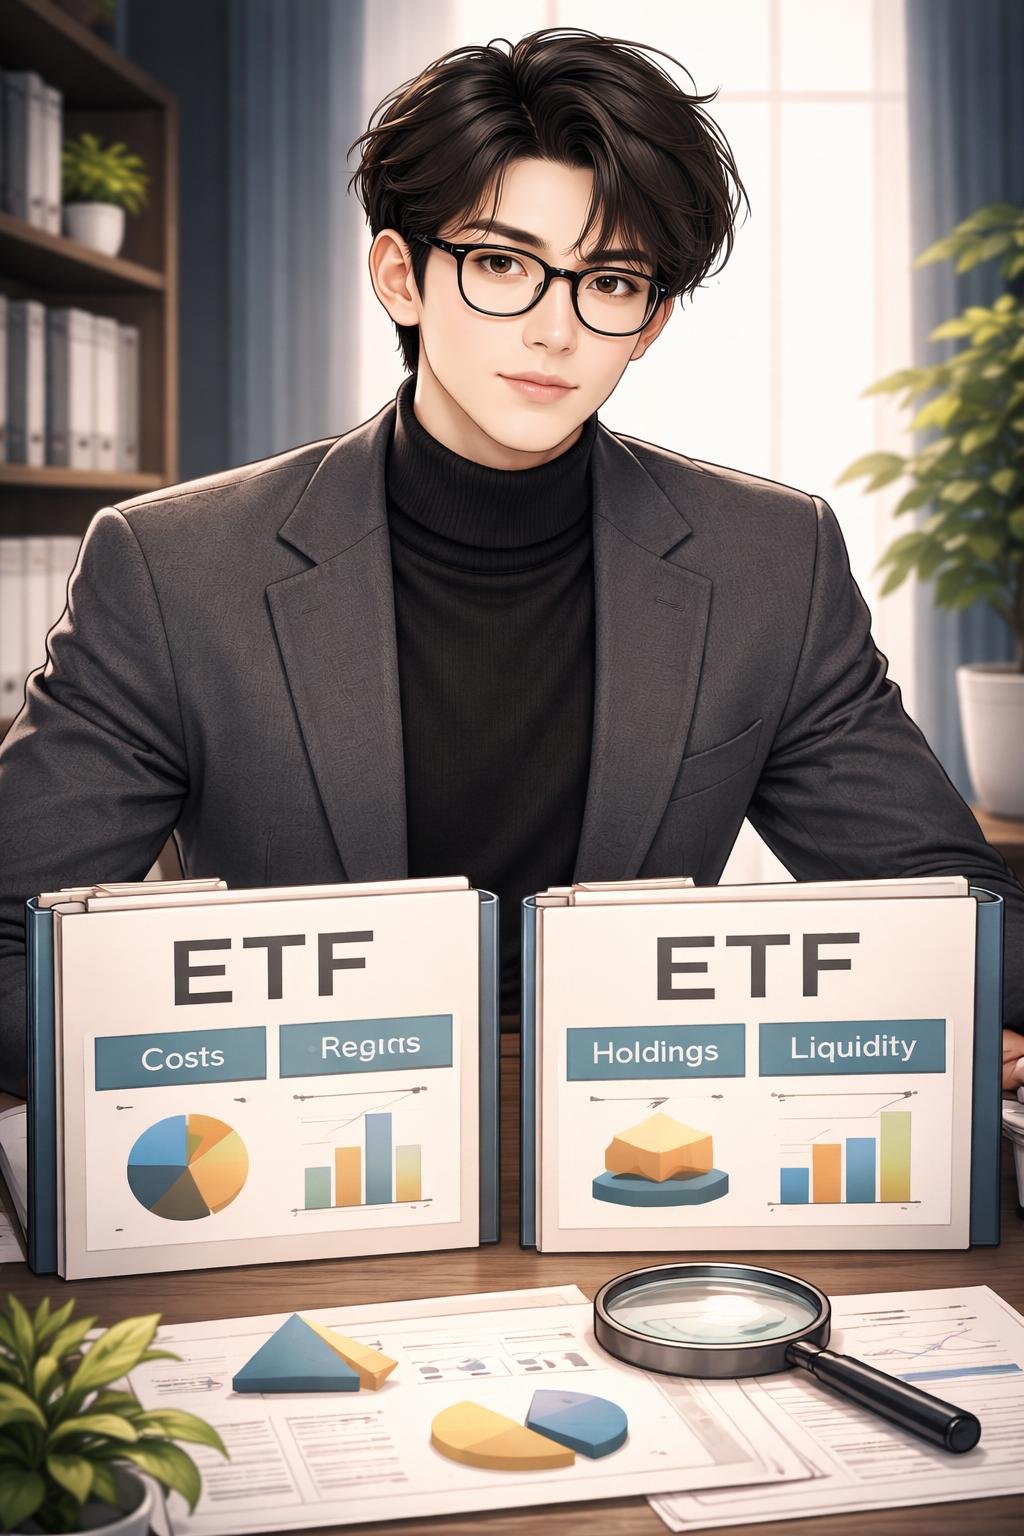
Two ETFs that appear similar can differ in their objectives, holdings, asset types, diversification, concentration, risks, expenses, and management approaches. Similar names do not establish that two funds provide the same exposure.
ETFs can also have different historical performance patterns, trading volumes, bid-ask spreads, market prices, and legal structures. These differences can affect both the risks of owning a fund and the costs of trading it.
A useful comparison starts with your intended exposure or objective. The findings should then be considered in light of your own circumstances, time horizon, objectives, and tolerance for risk rather than used as a universal ranking.
What to Gather Before Comparing ETFs
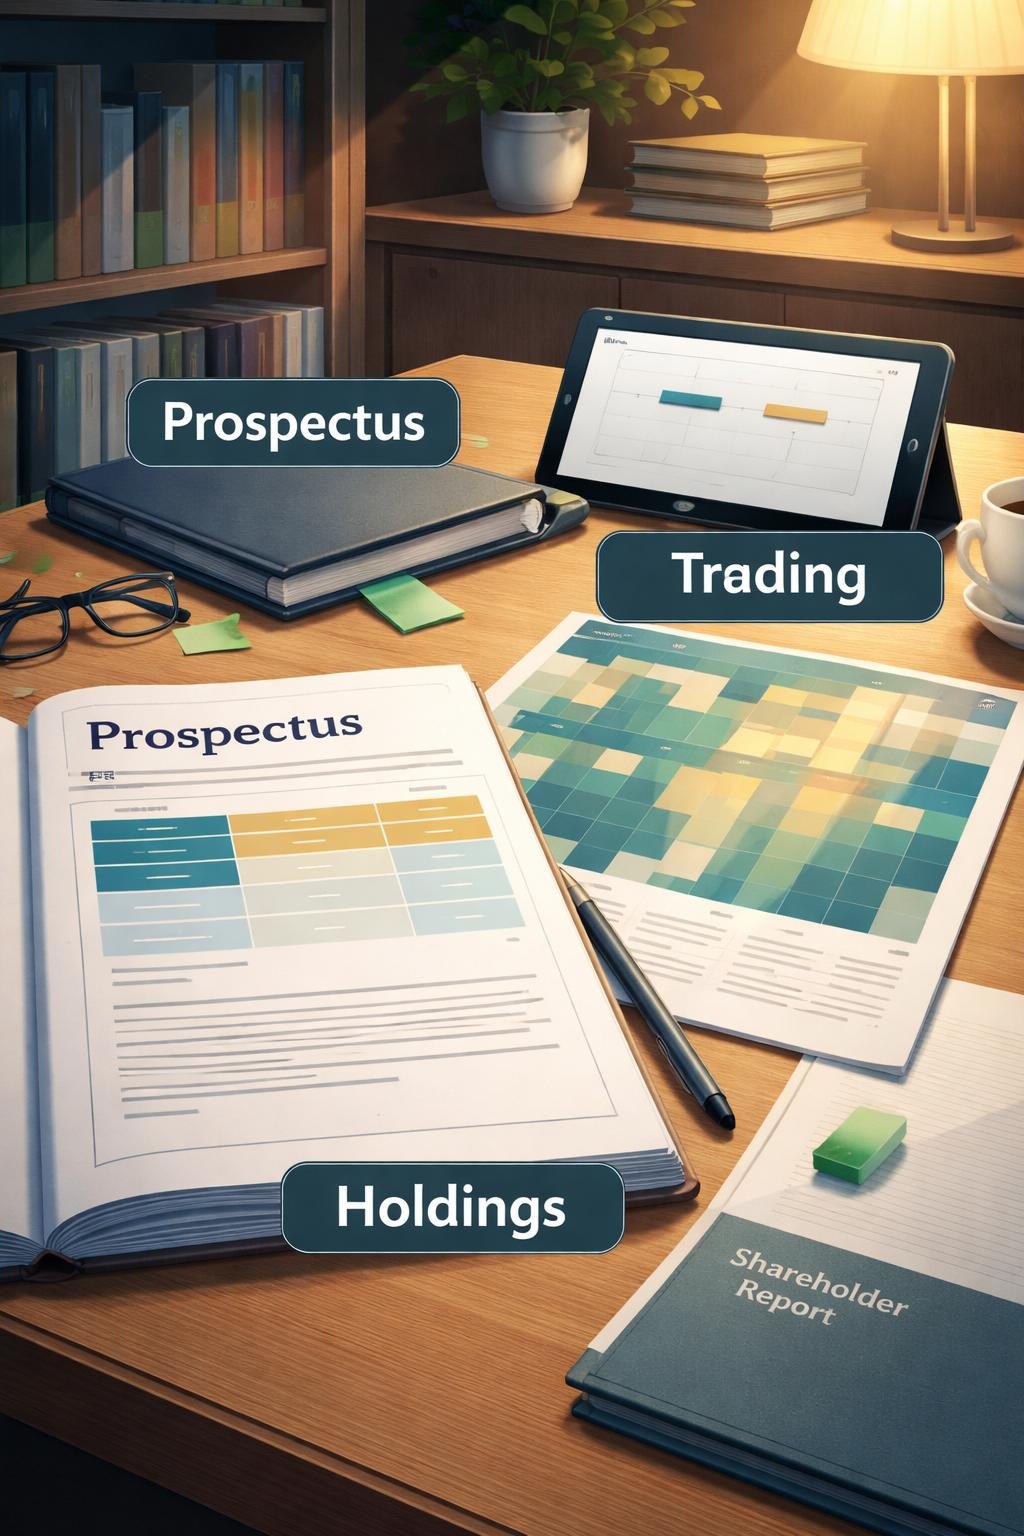
Start by defining what you intend to compare. For example, identify the asset type, market segment, strategy, or other exposure you are researching. Funds with materially different objectives may not form a meaningful side-by-side comparison.
Obtain the following information for each ETF from the fund’s current official materials or another reliable source:
- The current prospectus.
- The standardized fee table near the front of the prospectus.
- The latest shareholder report.
- Current holdings information.
- Reported historical performance data.
- Current trading information, including volume and bid-ask spreads.
- Current brokerage information about any applicable trading fees or commissions.
Use the same reporting period and, where relevant, the same end date for each performance comparison. Record the date of holdings and trading information so that older figures are not mistaken for current information.
Step-by-Step ETF Comparison Checklist
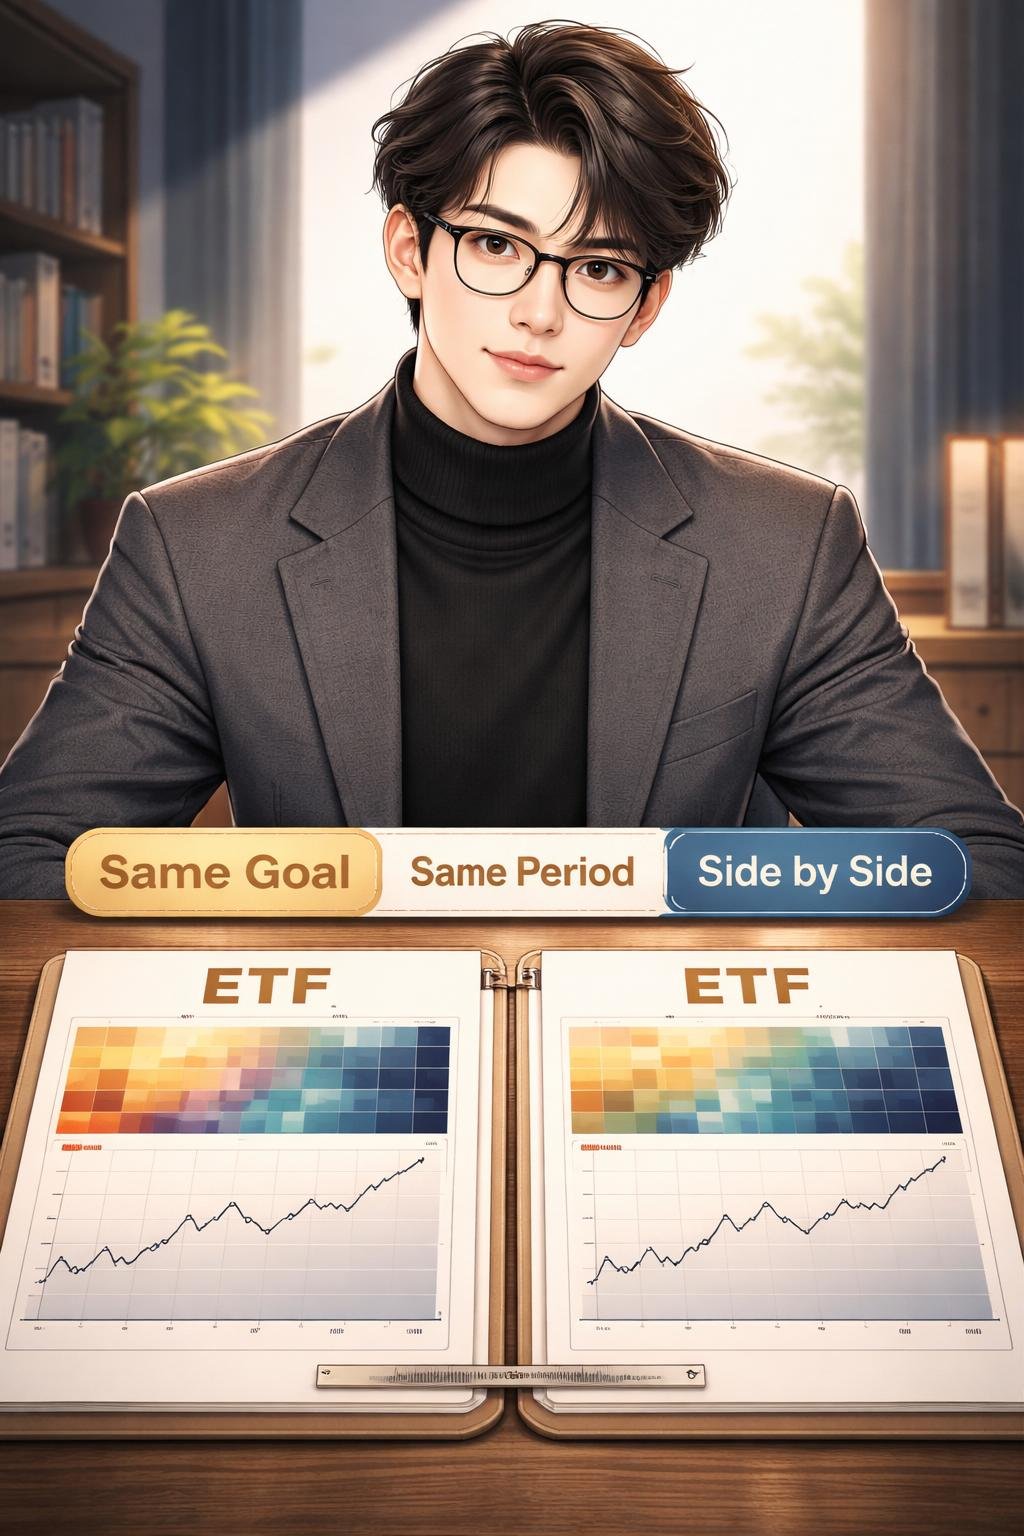
- Confirm that the ETFs pursue sufficiently comparable investment objectives.
- Review recurring operating expenses and transaction-related costs.
- Inspect the holdings, asset exposure, diversification, concentration, and stated risks.
- Compare reported historical performance over matching periods.
- Assess trading volume, bid-ask spreads, and other available liquidity information.
- Review each fund’s legal structure and active or passive management style.
- Record the findings side by side and consider the measures together.
A simple research worksheet can help prevent one metric from dominating the comparison:
| Comparison area | ETF A | ETF B |
|---|---|---|
| Investment objective | Record from current documents. | Record from current documents. |
| Fees and trading costs | Record current disclosures. | Record current disclosures. |
| Holdings and risks | Record exposure and document date. | Record exposure and document date. |
| Historical performance | Record period and end date. | Record the same period and end date. |
| Liquidity information | Record volume and spread information. | Record volume and spread information. |
| Structure and management | Record disclosed structure and style. | Record disclosed structure and style. |
The completed worksheet is a research aid, not a recommendation to buy, sell, hold, or avoid either fund.
1. Compare Fees and Trading Costs
ETF costs include recurring fund operating expenses and transaction-related expenses. Operating expenses can include investment advisory, marketing and distribution, brokerage, custodial, transfer agency, legal, and accounting costs. These costs are passed to shareholders through the fund.
Look for the standardized fee table near the front of each ETF’s prospectus. Use the same fee measure for both funds and check that the documents are current.
Costs matter because a higher-cost fund must produce greater performance than a lower-cost fund to provide the same investor return. Even small differences in costs can have a meaningful effect over time, but cost should not be considered separately from exposure, risk, liquidity, and structure.
Buying or selling ETF shares may also involve trading expenses or commissions. Brokerage fees and platform details can change, so verify them using current official information from the relevant brokerage rather than assuming that a trade is free.
2. Compare Holdings, Exposure, and Risk
Read each fund’s investment objective before examining individual holdings. The objective explains the exposure or result that the ETF is designed to pursue.
Next, identify the asset types held by the fund, such as stocks, bonds, money-market instruments, other assets, or a combination. Review how diversified or concentrated the holdings are and whether the fund follows a specialized strategy.
Concentration shows whether a large portion of the fund is connected to a limited group of holdings or exposures. Diversification and concentration can therefore help you understand how the fund’s risks are distributed, but they do not eliminate investment risk.
Do not assume that similar ETF names mean identical exposure. Check current holdings information, the prospectus, and the latest shareholder report, and note the date attached to the holdings data.
3. Compare Performance in Context
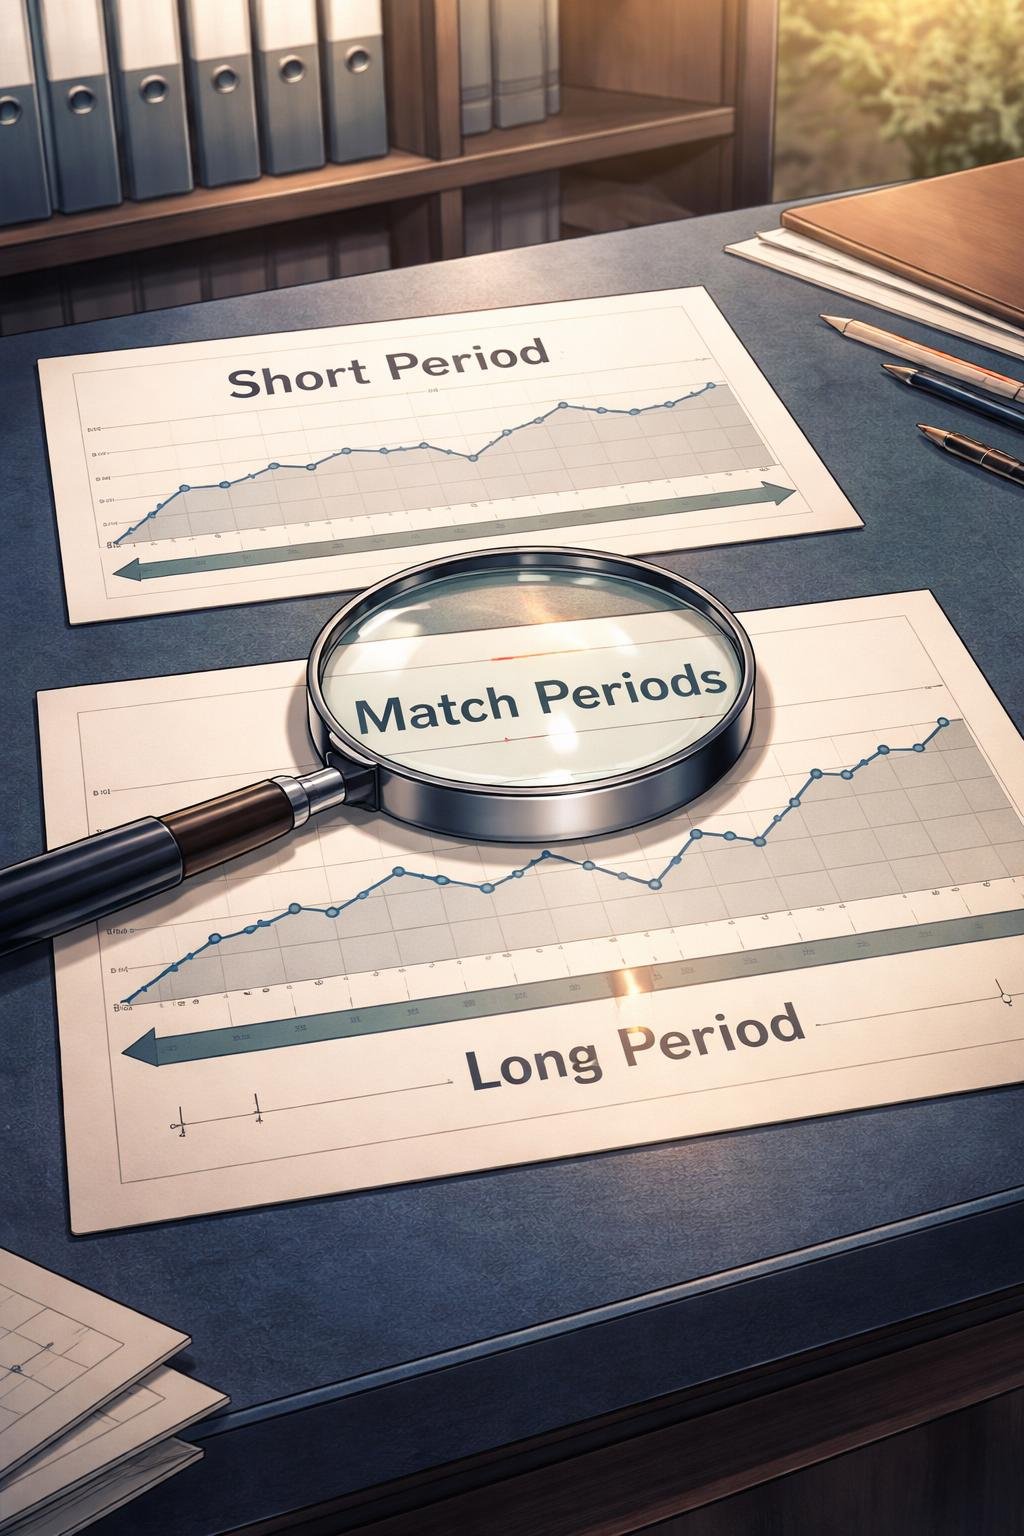
Compare reported historical results only when the measurement periods and relevant end dates match. A result covering one period should not be placed directly beside a result covering a different period without clearly identifying that difference.
Historical performance may help show how returns have varied and can provide information about past volatility or stability. Volatility refers to how much results have moved up and down over a period.
Past performance does not predict future returns. Reported results describe what happened during identified historical periods; they do not establish what an ETF will earn or lose in the future.
Record the source, reporting period, and end date for every figure used. If matching or sufficiently current information is unavailable, state that limitation instead of filling the gap with an estimate.
4. Compare Liquidity and Bid-Ask Spreads
Liquidity describes how readily a security can be traded. Trading volume shows how many shares are traded during a stated period and is one measure used when assessing liquidity.
Higher-volume securities are generally more liquid, while low trading volume can make large orders harder to execute quickly. Volume should still be considered with other trading information rather than treated as a complete measure by itself.
The bid is the price a buyer is willing to pay, and the ask is the price a seller is willing to accept. The difference between them is the bid-ask spread. A wider spread can increase the cost of completing a trade and reduce the investor’s return.
A narrow spread alone is not conclusive evidence of strong liquidity. The number of market participants and the trading interest available at different prices also matter. Because trading conditions can change, review current information rather than relying only on an older snapshot.
5. Compare Fund Structure and Management Style
Registered ETFs may be structured as open-end investment companies or unit investment trusts. Check the prospectus to identify the disclosed structure instead of assuming that all ETFs use the same legal form.
Also determine whether the ETF is a passively managed index fund or an actively managed fund. This distinction describes how the fund’s portfolio strategy is managed and should be considered alongside its stated objective, holdings, risks, and costs.
Net asset value, commonly abbreviated as NAV, represents the value of a fund’s assets after accounting for its liabilities on a per-share basis. An ETF’s exchange-traded market price can be above or below its NAV.
Review the current prospectus and latest shareholder report for information about structure, management, expenses, risks, and reported results. These documents provide context that a ticker symbol or market-price screen cannot provide by itself.
Important Risks and Limitations
- Investing involves risk, including the possibility of losing principal.
- Low costs do not establish that a fund matches an investor’s objective or risk tolerance.
- Historical returns do not predict future results.
- An ETF’s market price can trade above or below its NAV.
- Volume and bid-ask spreads provide useful liquidity information, but neither measure is conclusive by itself.
- Holdings, fees, market conditions, rules, regulations, brokerage fees, and platform details can change.
Verify material current information through relevant official fund, regulatory, exchange, and brokerage sources before making a financial decision. When information comes from different dates or reporting periods, disclose that limitation rather than treating the figures as directly comparable.
Common ETF Comparison Mistakes
- Comparing by name alone: Read the investment objective and current holdings because similar names may not represent identical exposure.
- Focusing only on the expense ratio: Review trading costs, holdings, risk, liquidity, performance context, and structure as well.
- Ignoring concentration: Check how the fund’s exposure is distributed rather than looking only at the number of holdings.
- Mixing performance periods: Use matching periods and identify the relevant end date for each result.
- Chasing recent returns: Treat performance as historical information, not as a forecast.
- Overlooking bid-ask spreads: Include the spread when evaluating potential trading costs.
- Assuming market price always equals NAV: Recognize that an ETF can trade above or below NAV.
- Relying on stale information: Check the date of each document, holdings list, performance figure, and trading measure.
- Treating a checklist as personal advice: Use the checklist for research while keeping the final decision tied to your own circumstances, objectives, and risk tolerance.
Frequently Asked Questions About Comparing ETFs
Is the lowest-cost ETF automatically preferable?
No single cost measure establishes whether an ETF fits a particular objective. Costs should be reviewed together with holdings, exposure, risk, liquidity, performance context, structure, and personal circumstances.
Where can I find an ETF’s fees and holdings?
The standardized fee table is generally located near the front of the prospectus. Current fund materials, including holdings information, the prospectus, and the latest shareholder report, can provide additional details. Confirm the document and data dates.
What does NAV mean?
NAV means net asset value. It is the value of a fund’s assets after accounting for liabilities on a per-share basis. An ETF’s market price can be higher or lower than its NAV.
How do volume and spreads relate to liquidity?
Higher trading volume generally indicates greater liquidity. A wide bid-ask spread can increase trading costs, but a narrow spread alone is not conclusive because market participation and available trading interest at different prices also matter.
Can active and passive ETFs be compared directly?
They can be placed in the same research worksheet, but first determine whether their objectives and exposures are sufficiently comparable. Their different management approaches should be recorded and considered rather than ignored.
Why can past performance not establish future returns?
Past performance reports what occurred during a historical period. Future market conditions and fund results are uncertain, so those historical results do not predict what an investor will earn or lose later.
Key Takeaway

Begin by establishing a comparable objective and collecting current official fund documents and reliable trading information. Review costs, holdings, exposure, risk, historical performance over matching periods, liquidity, structure, and management style together.
Account for the limits of each measure and verify important current details. Base financial decisions on your circumstances, objectives, and risk tolerance rather than on any single fee, return, rating, name, or trading statistic.
References
- Exchange-Traded Funds (ETFs) | Investor.gov: https://www.investor.gov/introduction-investing/investing-basics/investment-products/mutual-funds-and-exchange-traded-2
- Mutual Fund and ETF Fees and Expenses | Investor.gov: https://www.investor.gov/introduction-investing/investing-basics/glossary/mutual-fund-fees-and-expenses
- Understanding Disclosure Documents | Syndication: https://syndication.finra.org/content/understanding-disclosure-documents
Disclaimer
This article is provided for general educational and informational purposes only. It is not investment, financial, legal, or tax advice, and it is not a recommendation or solicitation to buy, sell, hold, or avoid any security or financial product. Financial information, company information, market conditions, fees, rules, regulations, and platform details can change. Investing involves risk, including the possible loss of principal. Verify important current information through relevant official sources and consider your circumstances, objectives, and risk tolerance before making financial decisions.
Image Notice: Images may be AI-generated educational illustrations provided for visual explanation only and should not be interpreted as exact representations of real companies, people, products, documents, financial data, or investment outcomes.